Technical analysis is a crucial tool used by traders to make informed decisions in the financial markets. By analyzing historical price data and volume, traders aim to predict future price movements and identify potential trading opportunities. Understanding how to use technical analysis effectively can significantly enhance a trader’s success in the market.
Key Concepts of Technical Analysis
Support and Resistance Levels
Support and resistance levels are key concepts in technical analysis. Support is a price level where a stock tends to stop falling, while resistance is a price level where a stock tends to stop rising. By identifying these levels on a price chart, traders can make more informed decisions about when to enter or exit a trade.
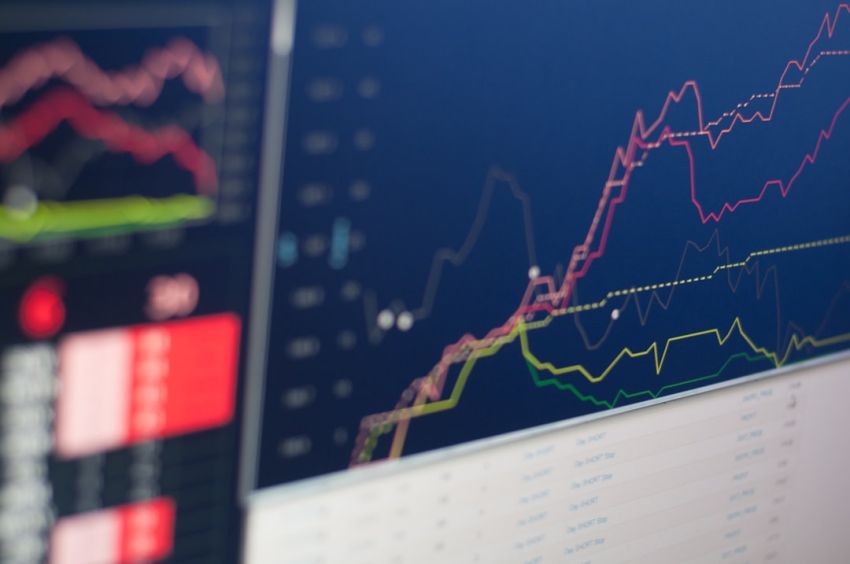
Trend Analysis
Trend analysis involves identifying the direction in which a stock is moving over time. Trends can be upward, downward, or sideways. Traders often use trend lines to visually represent the direction of a stock’s price movement. Understanding the current trend can help traders determine the best time to enter or exit a trade.
Technical Indicators
Technical indicators are mathematical calculations based on price, volume, or other market data. These indicators can help traders identify potential buy or sell signals. Common technical indicators include moving averages, relative strength index (RSI), and MACD (Moving Average Convergence Divergence). By incorporating technical indicators into their analysis, traders can gain valuable insights into market trends and potential price movements.
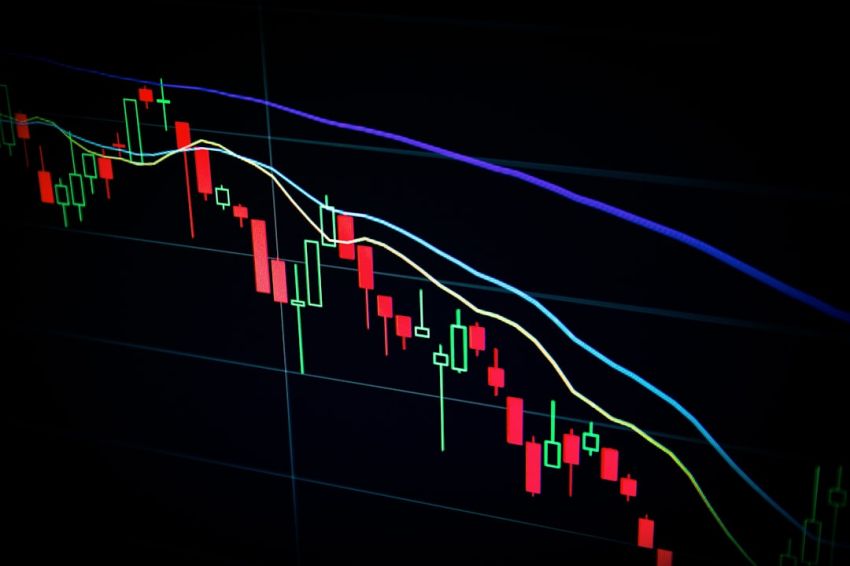
Candlestick Patterns
Candlestick patterns are visual representations of price movements on a chart. These patterns can provide valuable information about market sentiment and potential price reversals. Common candlestick patterns include Doji, Hammer, and Engulfing patterns. By recognizing these patterns, traders can make more informed decisions about when to enter or exit a trade.
How to Use Technical Analysis in Trading
Identifying Trading Opportunities
One of the primary ways to use technical analysis in trading is to identify potential trading opportunities. By analyzing price charts and technical indicators, traders can pinpoint key levels of support and resistance, trend directions, and potential entry and exit points. This information can help traders make more informed decisions about when to buy or sell a particular asset.
Risk Management
Another essential aspect of technical analysis in trading is risk management. By using technical analysis tools such as stop-loss orders and position sizing, traders can effectively manage their risk exposure. Stop-loss orders help traders limit potential losses by automatically closing a trade if the price moves against them. Position sizing involves determining the appropriate amount of capital to risk on each trade based on factors such as account size and risk tolerance.
Monitoring Trade Performance
Technical analysis can also be used to monitor trade performance and make adjustments as needed. By regularly analyzing price charts and technical indicators, traders can assess the success of their trades and identify areas for improvement. This ongoing analysis allows traders to adapt to changing market conditions and refine their trading strategies over time.
Conclusion: Enhancing Trading Success with Technical Analysis
In conclusion, technical analysis is a powerful tool that can help traders make more informed decisions in the financial markets. By understanding key concepts such as support and resistance levels, trend analysis, technical indicators, and candlestick patterns, traders can identify trading opportunities and manage risk effectively. Incorporating technical analysis into your trading strategy can enhance your success as a trader and give you a competitive edge in the market.